Line/Spectrum Fitting
One of the primary tasks in spectroscopic analysis is fitting models of spectra.
This concept is often applied mainly to line-fitting, but the same general
approach applies to continuum fitting or even full-spectrum fitting.
specutils provides conveniences that aim to leverage the general fitting
framework of astropy.modeling to spectral-specific tasks.
At a high level, this fitting takes the Spectrum1D object and a
list of Model objects that have initial guesses for each of
the parameters. these are used to create a compound model created from the model
initial guesses. This model is then actually fit to the spectrum’s flux,
yielding a single composite model result (which can be split back into its
components if desired).
Model (Line) Fitting
The generic model fitting machinery is well-suited to fitting spectral lines. The first step is to create a set of models with initial guesses as the parameters. To acheive better fits it may be wise to include a set of bounds for each parameter, but that is optional.
Note
A method to make plausible initial guesses will be provided in a future version, but user defined initial guesses are required at present.
Below are a series of examples of this sort of fitting.
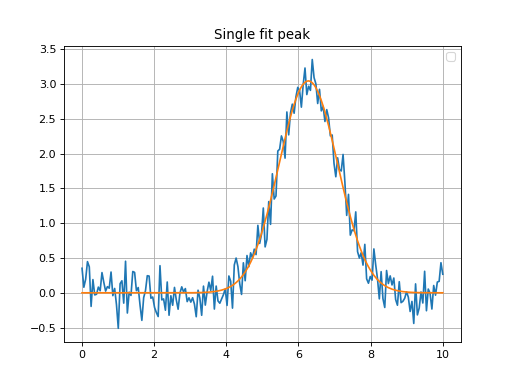
Simple Example
Below is a simple example to demonstrate how to use the
fit_lines method to fit a spectrum to an Astropy model
initial guess.
import numpy as np
import matplotlib.pyplot as plt

from astropy.modeling import models
from astropy import units as u

from specutils.spectra import Spectrum1D
from specutils.fitting import fit_lines

# Create a simple spectrum with a Gaussian.
np.random.seed(0)
x = np.linspace(0., 10., 200)
y = 3 * np.exp(-0.5 * (x- 6.3)**2 / 0.8**2)
y += np.random.normal(0., 0.2, x.shape)
spectrum = Spectrum1D(flux=y*u.Jy, spectral_axis=x*u.um)

# Fit the spectrum and calculate the fitted flux values (``y_fit``)
g_init = models.Gaussian1D(amplitude=3.*u.Jy, mean=6.1*u.um, stddev=1.*u.um)
g_fit = fit_lines(spectrum, g_init)
y_fit = g_fit(x*u.um)

# Plot the original spectrum and the fitted.
plt.plot(x, y)
plt.plot(x, y_fit)
plt.title('Single fit peak')
plt.grid('on')
plt.legend('Original Spectrum', 'Specutils Fit Result')
(Source code, png, hires.png, pdf)

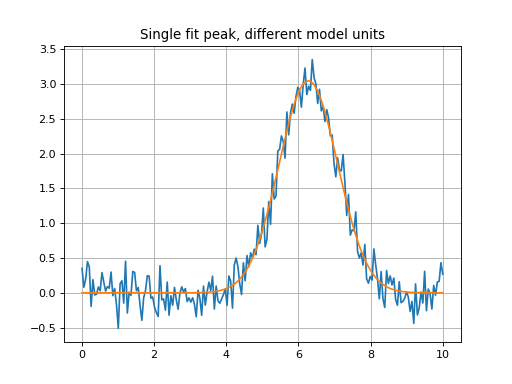
Simple Example with Different Units
Similar fit example to above, but the Gaussian model initial guess has different units. The fit will convert the initial guess to the spectral units, fit and then output the fitted model in the spectrum units.
import numpy as np
import matplotlib.pyplot as plt

from astropy.modeling import models
from astropy import units as u

from specutils.spectra import Spectrum1D
from specutils.fitting import fit_lines

# Create a simple spectrum with a Gaussian.
np.random.seed(0)
x = np.linspace(0., 10., 200)
y = 3 * np.exp(-0.5 * (x- 6.3)**2 / 0.8**2)
y += np.random.normal(0., 0.2, x.shape)

# Create the spectrum
spectrum = Spectrum1D(flux=y*u.Jy, spectral_axis=x*u.um)

# Fit the spectrum
g_init = models.Gaussian1D(amplitude=3.*u.Jy, mean=61000*u.AA, stddev=10000.*u.AA)
g_fit = fit_lines(spectrum, g_init)
y_fit = g_fit(x*u.um)

plt.plot(x, y)
plt.plot(x, y_fit)
plt.title('Single fit peak, different model units')
plt.grid('on')
(Source code, png, hires.png, pdf)
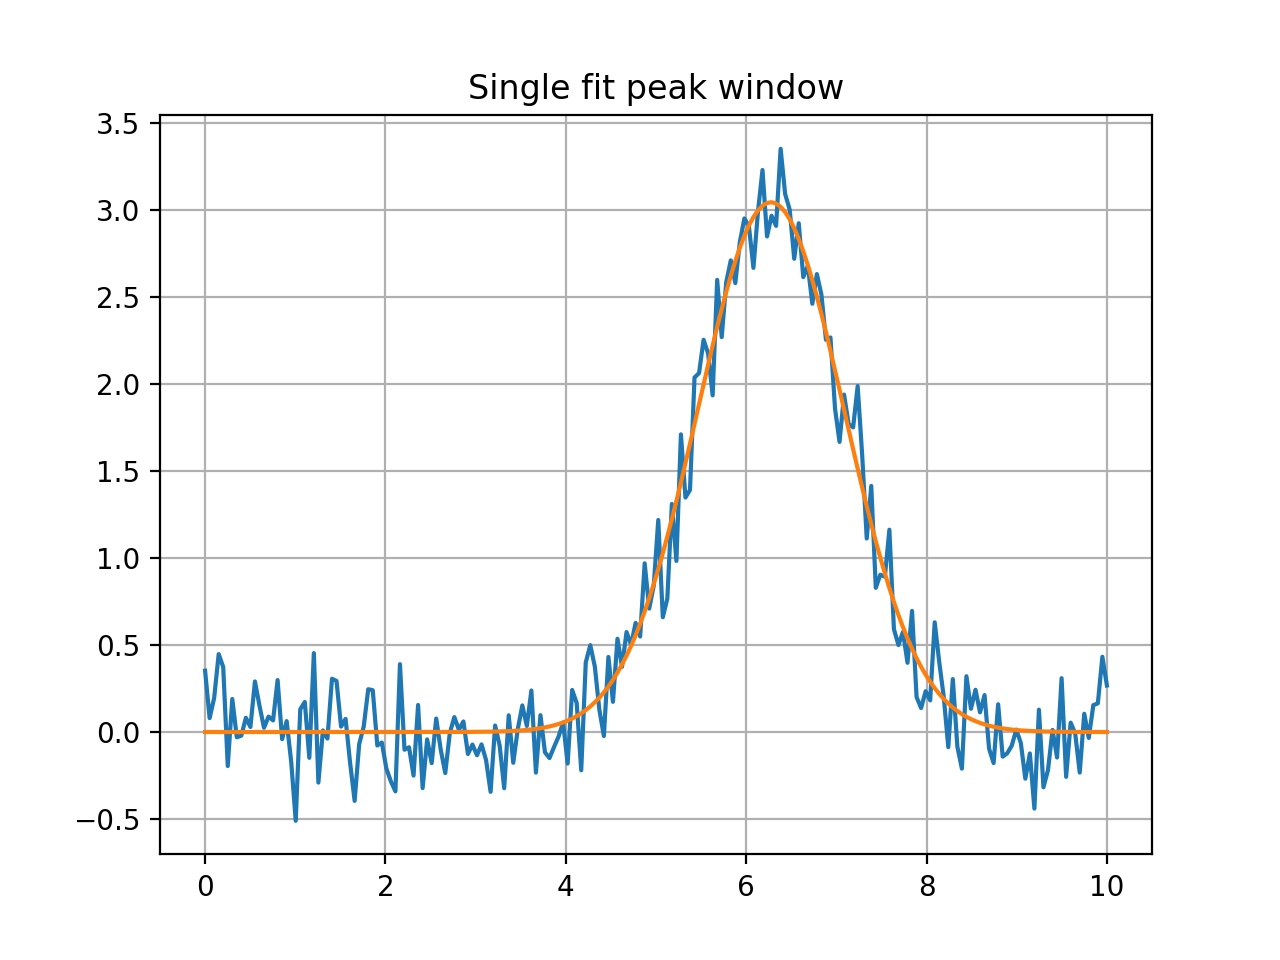
Single Peak Fit Within a Window (Defined by Center)
Single peak fit with a window of 2*u.um around the center of the
mean of the model initial guess (so 2*u.um around 5.5*u.um).
import numpy as np
import matplotlib.pyplot as plt

from astropy.modeling import models
from astropy import units as u

from specutils.spectra import Spectrum1D
from specutils.fitting import fit_lines

# Create a simple spectrum with a Gaussian.
np.random.seed(0)
x = np.linspace(0., 10., 200)
y = 3 * np.exp(-0.5 * (x- 6.3)**2 / 0.8**2)
y += np.random.normal(0., 0.2, x.shape)

# Create the spectrum
spectrum = Spectrum1D(flux=y*u.Jy, spectral_axis=x*u.um)

# Fit the spectrum
g_init = models.Gaussian1D(amplitude=3.*u.Jy, mean=5.5*u.um, stddev=1.*u.um)
g_fit = fit_lines(spectrum, g_init, window=2*u.um)
y_fit = g_fit(x*u.um)

plt.plot(x, y)
plt.plot(x, y_fit)
plt.title('Single fit peak window')
plt.grid('on')
(Source code, png, hires.png, pdf)

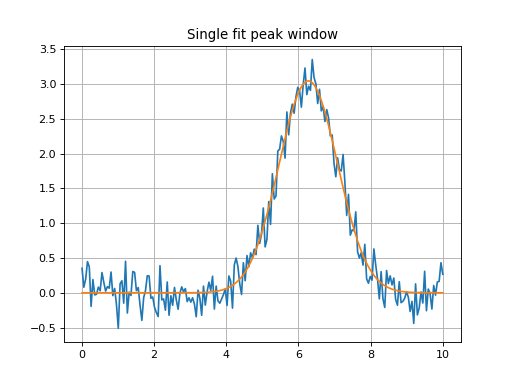
Single Peak Fit Within a Window (Defined by Left and Right)
Single peak fit using spectral data only within the window
6*u.um to 7*u.um, all other data will be ignored.
import numpy as np
import matplotlib.pyplot as plt

from astropy.modeling import models
from astropy import units as u

from specutils.spectra import Spectrum1D
from specutils.fitting import fit_lines

# Create a simple spectrum with a Gaussian.
np.random.seed(0)
x = np.linspace(0., 10., 200)
y = 3 * np.exp(-0.5 * (x- 6.3)**2 / 0.8**2)
y += np.random.normal(0., 0.2, x.shape)

# Create the spectrum
spectrum = Spectrum1D(flux=y*u.Jy, spectral_axis=x*u.um)

# Fit the spectrum
g_init = models.Gaussian1D(amplitude=3.*u.Jy, mean=5.5*u.um, stddev=1.*u.um)
g_fit = fit_lines(spectrum, g_init, window=(6*u.um, 7*u.um))
y_fit = g_fit(x*u.um)

plt.plot(x, y)
plt.plot(x, y_fit)
plt.title('Single fit peak window')
plt.grid('on')
(Source code, png, hires.png, pdf)

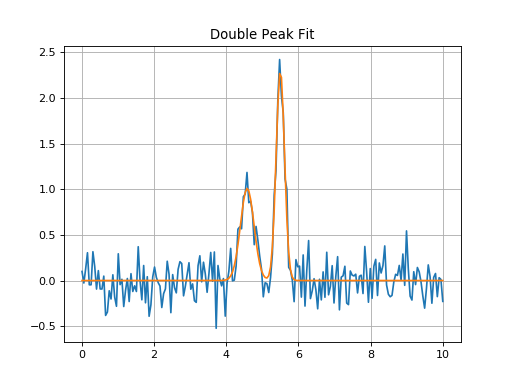
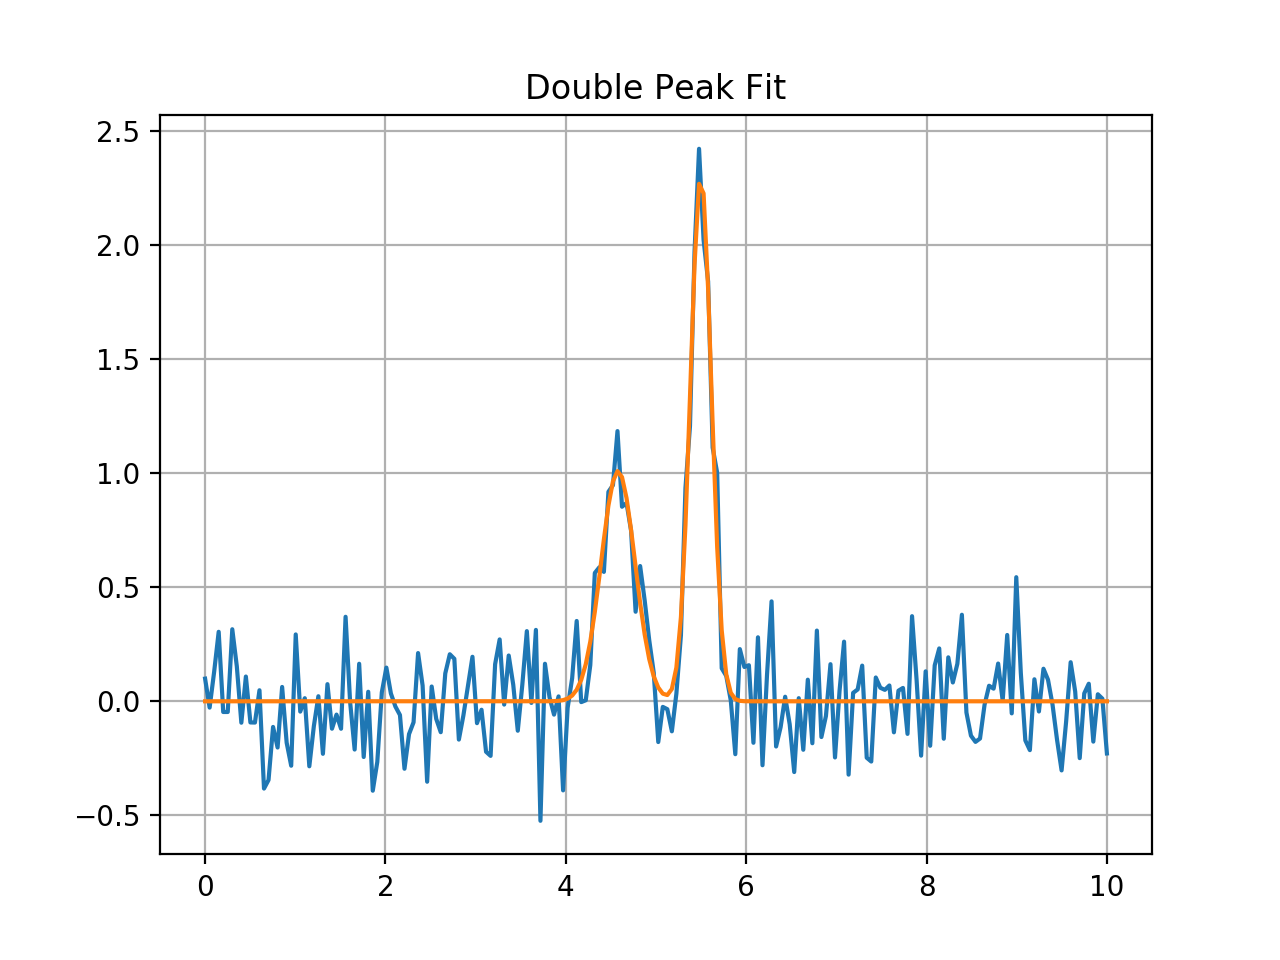
Double Peak Fit
Double peak fit compound model initial guess in and compound model out.
import numpy as np
import matplotlib.pyplot as plt

from astropy.modeling import models
from astropy import units as u

from specutils.spectra import Spectrum1D
from specutils.fitting import fit_lines

# Create a simple spectrum with a Gaussian.
np.random.seed(42)

g1 = models.Gaussian1D(1, 4.6, 0.2)
g2 = models.Gaussian1D(2.5, 5.5, 0.1)
x = np.linspace(0, 10, 200)
y = g1(x) + g2(x) + np.random.normal(0., 0.2, x.shape)

# Create the spectrum to fit
spectrum = Spectrum1D(flux=y*u.Jy, spectral_axis=x*u.um)

# Fit the spectrum
g1_init = models.Gaussian1D(amplitude=2.3*u.Jy, mean=5.6*u.um, stddev=0.1*u.um)
g2_init = models.Gaussian1D(amplitude=1.*u.Jy, mean=4.4*u.um, stddev=0.1*u.um)
g12_fit = fit_lines(spectrum, g1_init+g2_init)
y_fit = g12_fit(x*u.um)

plt.plot(x, y)
plt.plot(x, y_fit)
plt.title('Double Peak Fit')
plt.grid('on')
(Source code, png, hires.png, pdf)

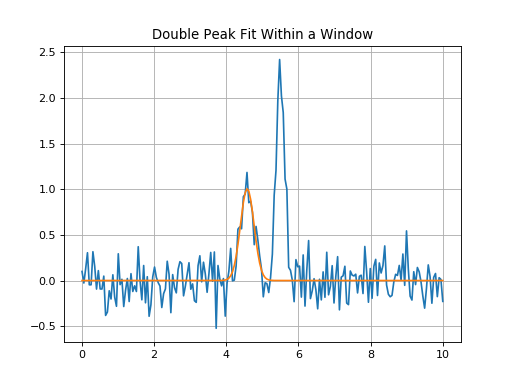
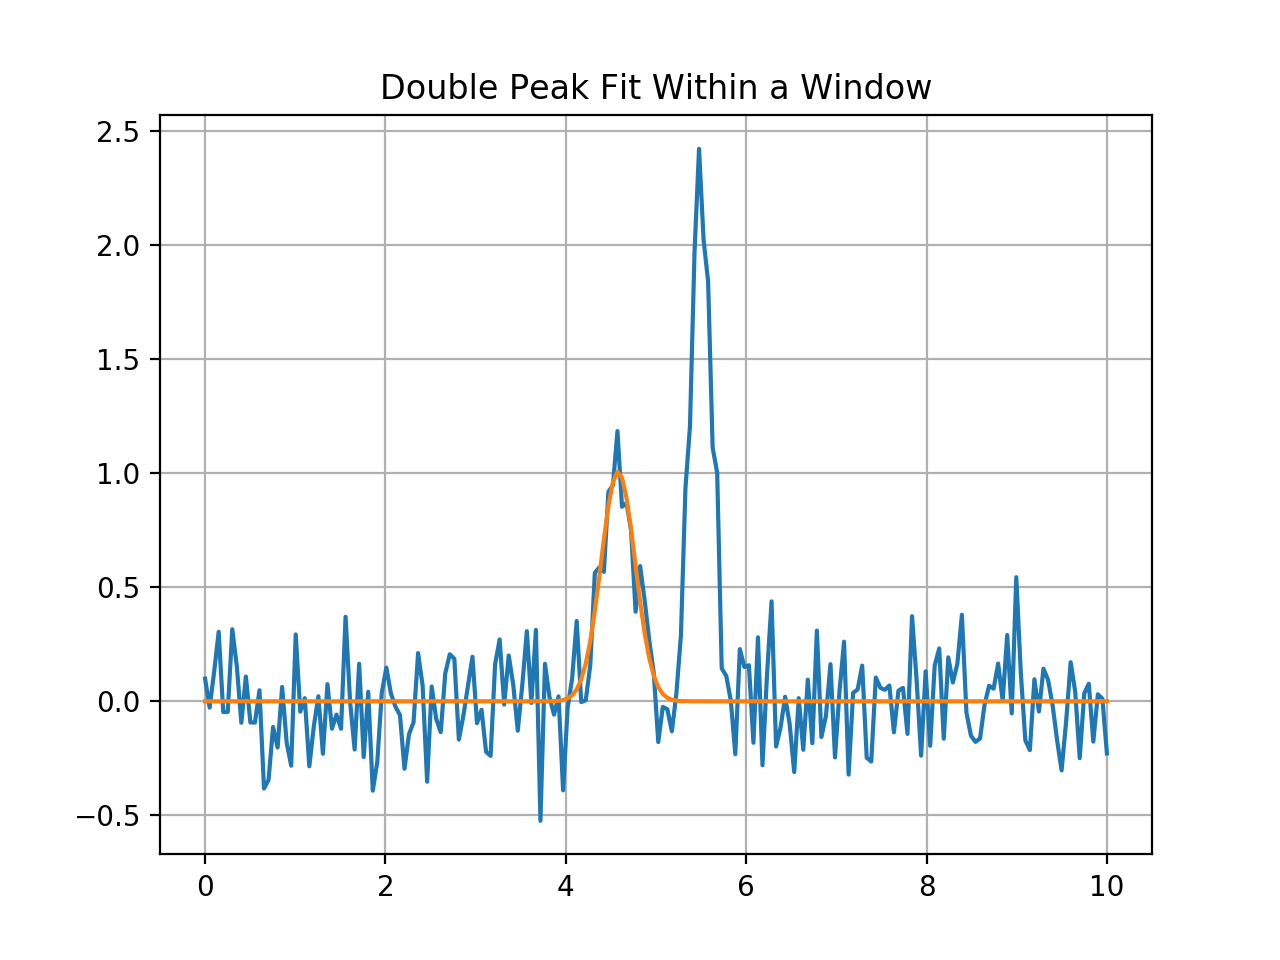
Double Peak Fit Within a Window
Double peak fit using data in the spectrum from 4.3*u.um to 5.3*u.um, only.
import numpy as np
import matplotlib.pyplot as plt

from astropy.modeling import models
from astropy import units as u

from specutils.spectra import Spectrum1D
from specutils.fitting import fit_lines

# Create a simple spectrum with a Gaussian.
np.random.seed(42)

g1 = models.Gaussian1D(1, 4.6, 0.2)
g2 = models.Gaussian1D(2.5, 5.5, 0.1)
x = np.linspace(0, 10, 200)
y = g1(x) + g2(x) + np.random.normal(0., 0.2, x.shape)

# Create the spectrum to fit
spectrum = Spectrum1D(flux=y*u.Jy, spectral_axis=x*u.um)

# Fit the spectrum
g2_init = models.Gaussian1D(amplitude=1.*u.Jy, mean=4.7*u.um, stddev=0.2*u.um)
g2_fit = fit_lines(spectrum, g2_init, window=(4.3*u.um, 5.3*u.um))
y_fit = g2_fit(x*u.um)

plt.plot(x, y)
plt.plot(x, y_fit)
plt.title('Double Peak Fit Within a Window')
plt.grid('on')
(Source code, png, hires.png, pdf)

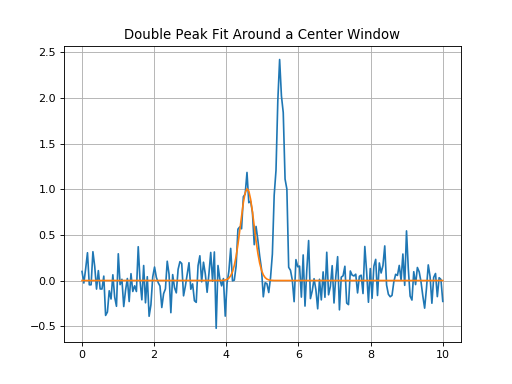
Double Peak Fit Within Around a Center Window
Double peak fit using data in the spectrum centered on 4.7*u.um +/- 0.3*u.um.
import numpy as np
import matplotlib.pyplot as plt

from astropy.modeling import models
from astropy import units as u

from specutils.spectra import Spectrum1D
from specutils.fitting import fit_lines

# Create a simple spectrum with a Gaussian.
np.random.seed(42)

g1 = models.Gaussian1D(1, 4.6, 0.2)
g2 = models.Gaussian1D(2.5, 5.5, 0.1)
x = np.linspace(0, 10, 200)
y = g1(x) + g2(x) + np.random.normal(0., 0.2, x.shape)

# Create the spectrum to fit
spectrum = Spectrum1D(flux=y*u.Jy, spectral_axis=x*u.um)

# Fit the spectrum
g2_init = models.Gaussian1D(amplitude=1.*u.Jy, mean=4.7*u.um, stddev=0.2*u.um)
g2_fit = fit_lines(spectrum, g2_init, window=0.3*u.um)
y_fit = g2_fit(x*u.um)

plt.plot(x, y)
plt.plot(x, y_fit)
plt.title('Double Peak Fit Around a Center Window')
plt.grid('on')
(Source code, png, hires.png, pdf)

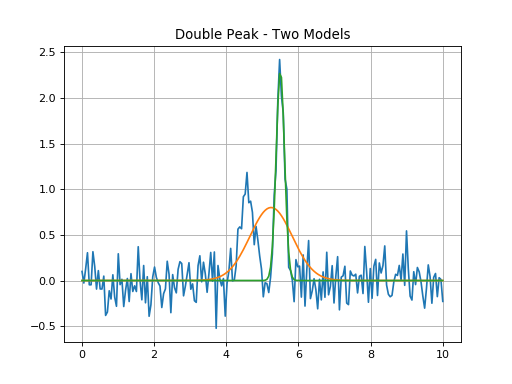
Double Peak Fit - Two Separate Peaks
Double peak fit where each model gl_init and gr_init is fit separately,
each within 0.2*u.um of the model’s mean.
import numpy as np
import matplotlib.pyplot as plt

from astropy.modeling import models
from astropy import units as u

from specutils.spectra import Spectrum1D
from specutils.fitting import fit_lines

# Create a simple spectrum with a Gaussian.
np.random.seed(42)

g1 = models.Gaussian1D(1, 4.6, 0.2)
g2 = models.Gaussian1D(2.5, 5.5, 0.1)
x = np.linspace(0, 10, 200)
y = g1(x) + g2(x) + np.random.normal(0., 0.2, x.shape)

# Create the spectrum to fit
spectrum = Spectrum1D(flux=y*u.Jy, spectral_axis=x*u.um)

# Fit each peak
gl_init = models.Gaussian1D(amplitude=1.*u.Jy, mean=4.8*u.um, stddev=0.2*u.um)
gr_init = models.Gaussian1D(amplitude=2.*u.Jy, mean=5.3*u.um, stddev=0.2*u.um)
gl_fit, gr_fit = fit_lines(spectrum, [gl_init, gr_init], window=0.2*u.um)
yl_fit = gl_fit(x*u.um)
yr_fit = gr_fit(x*u.um)

plt.plot(x, y)
plt.plot(x, yl_fit)
plt.plot(x, yr_fit)
plt.title('Double Peak - Two Models')
plt.grid('on')
(Source code, png, hires.png, pdf)
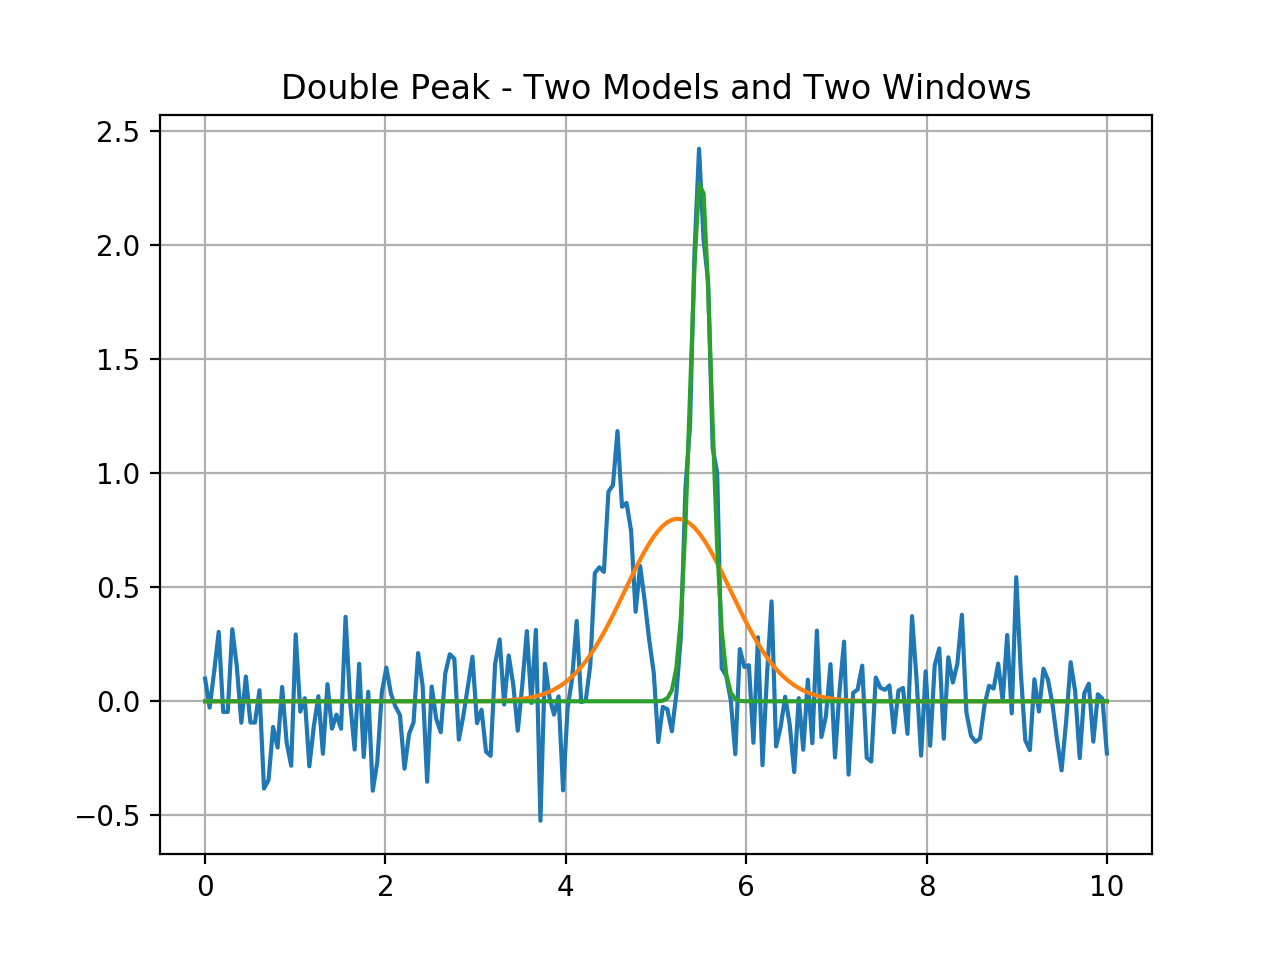
Double Peak Fit - Two Separate Peaks With Two Windows
Double peak fit where each model gl_init and gr_init is fit within
the corresponding window.
import numpy as np
import matplotlib.pyplot as plt

from astropy.modeling import models
from astropy import units as u

from specutils.spectra import Spectrum1D
from specutils.fitting import fit_lines

# Create a simple spectrum with a Gaussian.
np.random.seed(42)

g1 = models.Gaussian1D(1, 4.6, 0.2)
g2 = models.Gaussian1D(2.5, 5.5, 0.1)
x = np.linspace(0, 10, 200)
y = g1(x) + g2(x) + np.random.normal(0., 0.2, x.shape)

# Create the spectrum to fit
spectrum = Spectrum1D(flux=y*u.Jy, spectral_axis=x*u.um)

# Fit each peak
gl_init = models.Gaussian1D(amplitude=1.*u.Jy, mean=4.8*u.um, stddev=0.2*u.um)
gr_init = models.Gaussian1D(amplitude=2.*u.Jy, mean=5.3*u.um, stddev=0.2*u.um)
gl_fit, gr_fit = fit_lines(spectrum, [gl_init, gr_init], window=[(5.3*u.um, 5.8*u.um), (4.6*u.um, 5.3*u.um)])
yl_fit = gl_fit(x*u.um)
yr_fit = gr_fit(x*u.um)

plt.plot(x, y)
plt.plot(x, yl_fit)
plt.plot(x, yr_fit)
plt.title('Double Peak - Two Models and Two Windows')
plt.grid('on')
(Source code, png, hires.png, pdf)
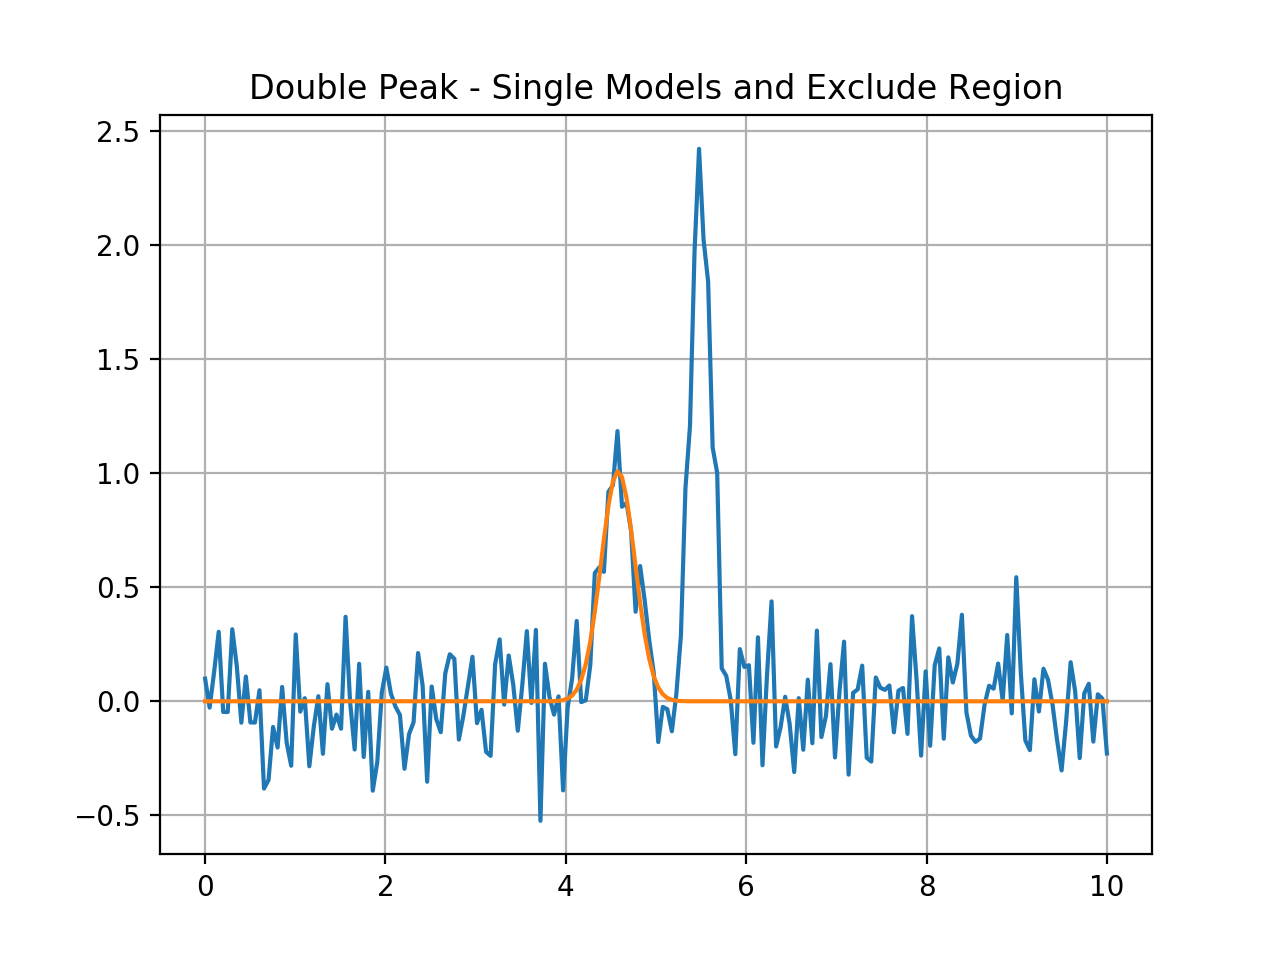
Double Peak Fit - Exclude One Region
Double peak fit where each model gl_init and gr_init is fit using
all the data except between 5.2*u.um and 5.8*u.um.
import numpy as np
import matplotlib.pyplot as plt

from astropy.modeling import models
from astropy import units as u

from specutils.spectra import Spectrum1D, SpectralRegion
from specutils.fitting import fit_lines

# Create a simple spectrum with a Gaussian.
np.random.seed(42)

g1 = models.Gaussian1D(1, 4.6, 0.2)
g2 = models.Gaussian1D(2.5, 5.5, 0.1)
x = np.linspace(0, 10, 200)
y = g1(x) + g2(x) + np.random.normal(0., 0.2, x.shape)

# Create the spectrum to fit
spectrum = Spectrum1D(flux=y*u.Jy, spectral_axis=x*u.um)

# Fit each peak
gl_init = models.Gaussian1D(amplitude=1.*u.Jy, mean=4.8*u.um, stddev=0.2*u.um)
gl_fit = fit_lines(spectrum, gl_init, exclude_regions=[SpectralRegion(5.2*u.um, 5.8*u.um)])
yl_fit = gl_fit(x*u.um)

plt.plot(x, y)
plt.plot(x, yl_fit)
plt.title('Double Peak - Single Models and Exclude Region')
plt.grid('on')
(Source code, png, hires.png, pdf)

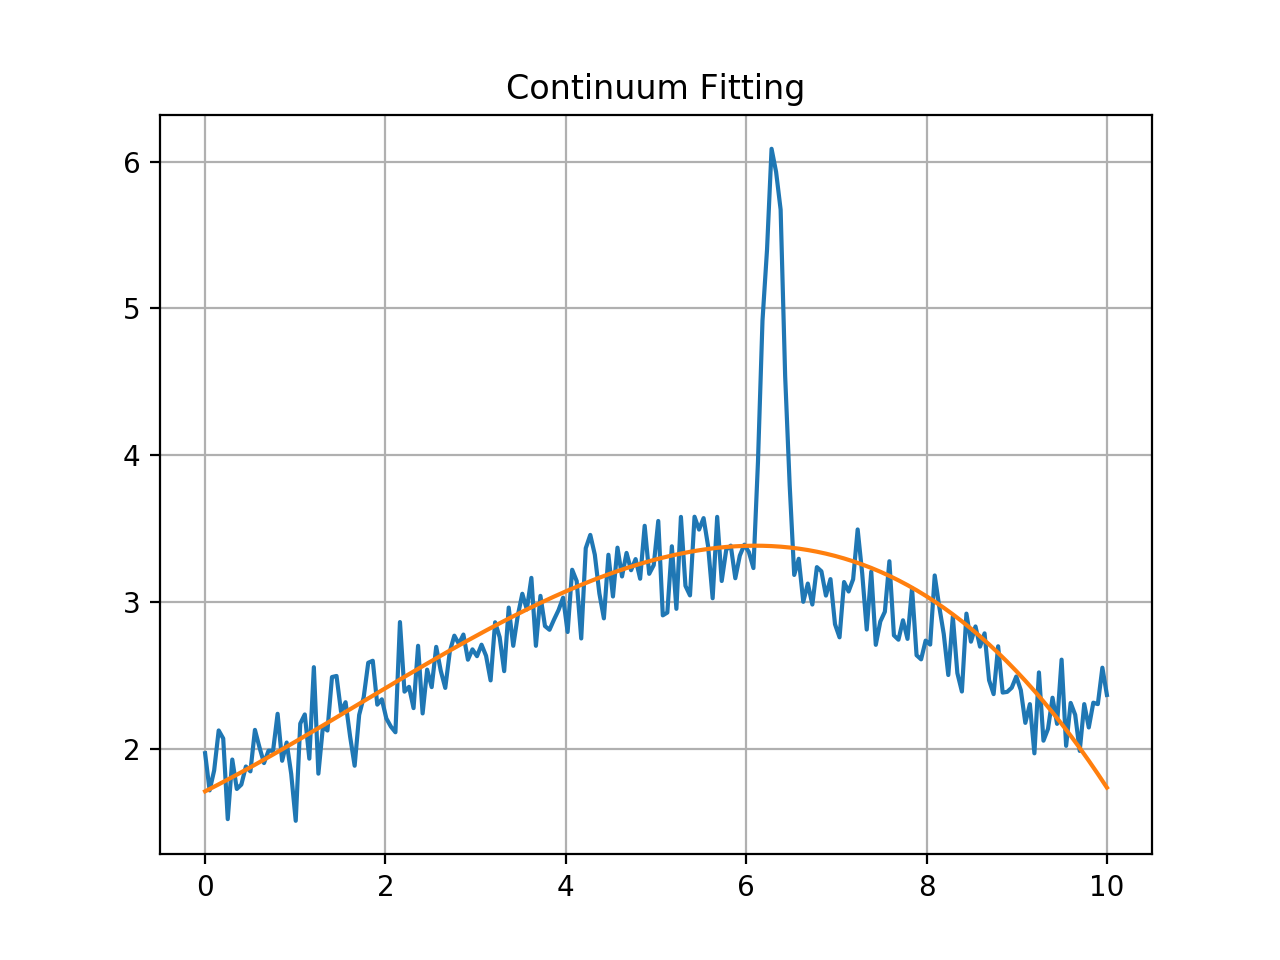
Continuum Fitting
While the line-fitting machinery can be used to fit continuua at the same time
as models, often it is convenient to subtract or normalize a spectrum by its
continuum before other processing is done. specutils provides some
convenience functions to perform exactly this task. An example is shown below.
import numpy as np
import matplotlib.pyplot as plt

from astropy.modeling import models
from astropy import units as u

from specutils.spectra import Spectrum1D, SpectralRegion
from specutils.fitting import fit_generic_continuum

np.random.seed(0)
x = np.linspace(0., 10., 200)
y = 3 * np.exp(-0.5 * (x - 6.3)**2 / 0.1**2)
y += np.random.normal(0., 0.2, x.shape)

y_continuum = 3.2 * np.exp(-0.5 * (x - 5.6)**2 / 4.8**2)
y += y_continuum

spectrum = Spectrum1D(flux=y*u.Jy, spectral_axis=x*u.um)

g1_fit = fit_generic_continuum(spectrum)

y_continuum_fitted = g1_fit(x)

plt.plot(x, y)
plt.plot(x, y_continuum_fitted)
plt.title('Continuum Fitting')
plt.grid('on')
(Source code, png, hires.png, pdf)
Reference/API
Functions
fit_continuum(spectrum[, model, c0, c1, c2, …]) |
Entry point for fitting using the fitting machinery. |
fit_generic_continuum(spectrum[, …]) |
Basic fitting of the continuum of an input spectrum. |
fit_lines(spectrum, model[, fitter, …]) |
Fit the input models to the spectrum. |