Specutils Documentation
The specutils package provides a basic interface for the loading,
manipulation, and common forms of analysis of spectroscopic data. These
generic data containers and accompanying modules will provide a toolbox that the
astronomical community can use to build more domain-specific packages. For more
details about the underlying principles, see
APE13, the
guiding document for spectroscopic development in the Astropy Project.
Note
While specutils is available for general use, the API is in an early enough development stage that some interfaces may change if user feedback and experience warrants it.
Getting started with specutils
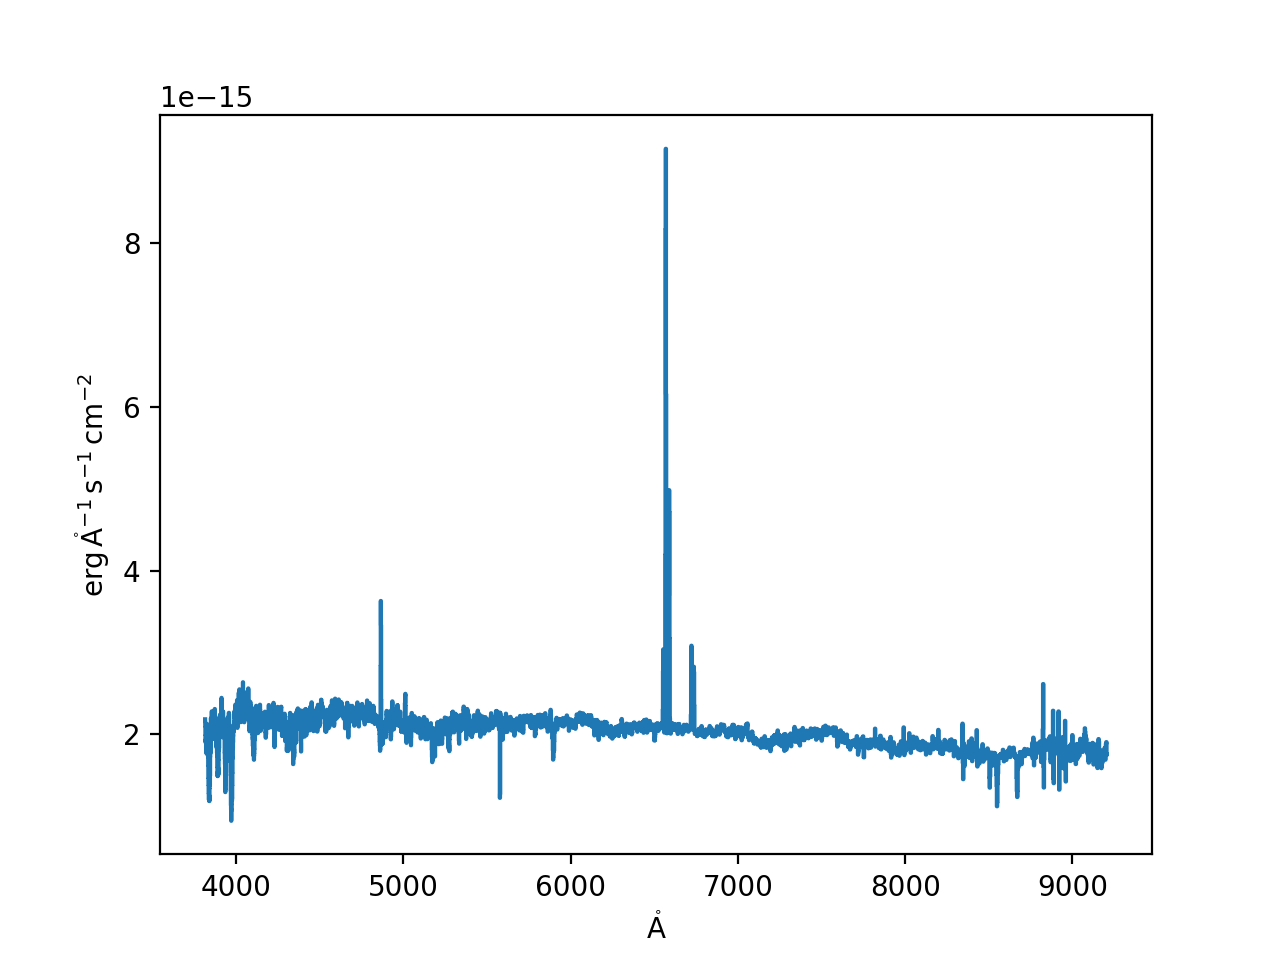
As a basic example, consider an emission line galaxy spectrum from the SDSS. We will use this as a proxy for a spectrum you may have downloaded from some archive, or reduced from your own observations.
We begin with some basic imports:
>>> from astropy.io import fits
>>> from astropy import units as u
>>> import numpy as np
>>> from matplotlib import pyplot as plt
>>> from astropy.visualization import quantity_support
>>> quantity_support()  # for getting units on the axes below
<astropy.visualization.units.quantity_support...>
Now we load the dataset from it’s canonical source:
>>> f = fits.open('https://dr14.sdss.org/optical/spectrum/view/data/format=fits/spec=lite?plateid=1323&mjd=52797&fiberid=12')
Downloading ...
>>> specdata = f[1].data
>>> f.close()
Then we re-format this dataset into astropy quantities, and create a
Spectrum1D object:
>>> from specutils import Spectrum1D
>>> lamb = 10**specdata['loglam'] * u.AA
>>> flux = specdata['flux'] * 10**-17 *u.erg *u.s**-1*u.cm**-2 / u.AA
>>> spec = Spectrum1D(spectral_axis=lamb, flux=flux)
And we plot it:
>>> lines = plt.step(spec.spectral_axis, spec.flux)
(Source code, png, hires.png, pdf)

Now maybe you want the equivalent width of a spectral line (which requires normalizing by a continuum estimate):
>>> from specutils import SpectralRegion
>>> from specutils.analysis import equivalent_width
>>> cont_norm_spec = spec / np.median(spec.flux)  # TODO: replace this with fit_generic_continuum
>>> fig = plt.figure()
>>> lines = plt.step(cont_norm_spec.wavelength, cont_norm_spec.flux)
>>> plt.xlim(654*u.nm, 660*u.nm)
>>> equivalent_width(spec, regions=SpectralRegion(6562*u.AA, 6575*u.AA))
<Quantity -10.58691406 Angstrom>
While there are other tools and spectral representations detailed more below,
this gives a test of the sort of analysis specutils enables.
Using specutils
For more details on usage of specutils, see the sections listed below.
Get Involved
Please see Contributing for information on bug reporting and contributing to the specutils project.