Working with Spectrum1Ds
As described in more detail in Overview of How Specutils Represents Spectra, the core data class in
specutils for a single spectrum is Spectrum1D. This object
can represent either one or many spectra, all with the same spectral_axis.
This section describes some of the basic features of this class.
Basic Spectrum Creation
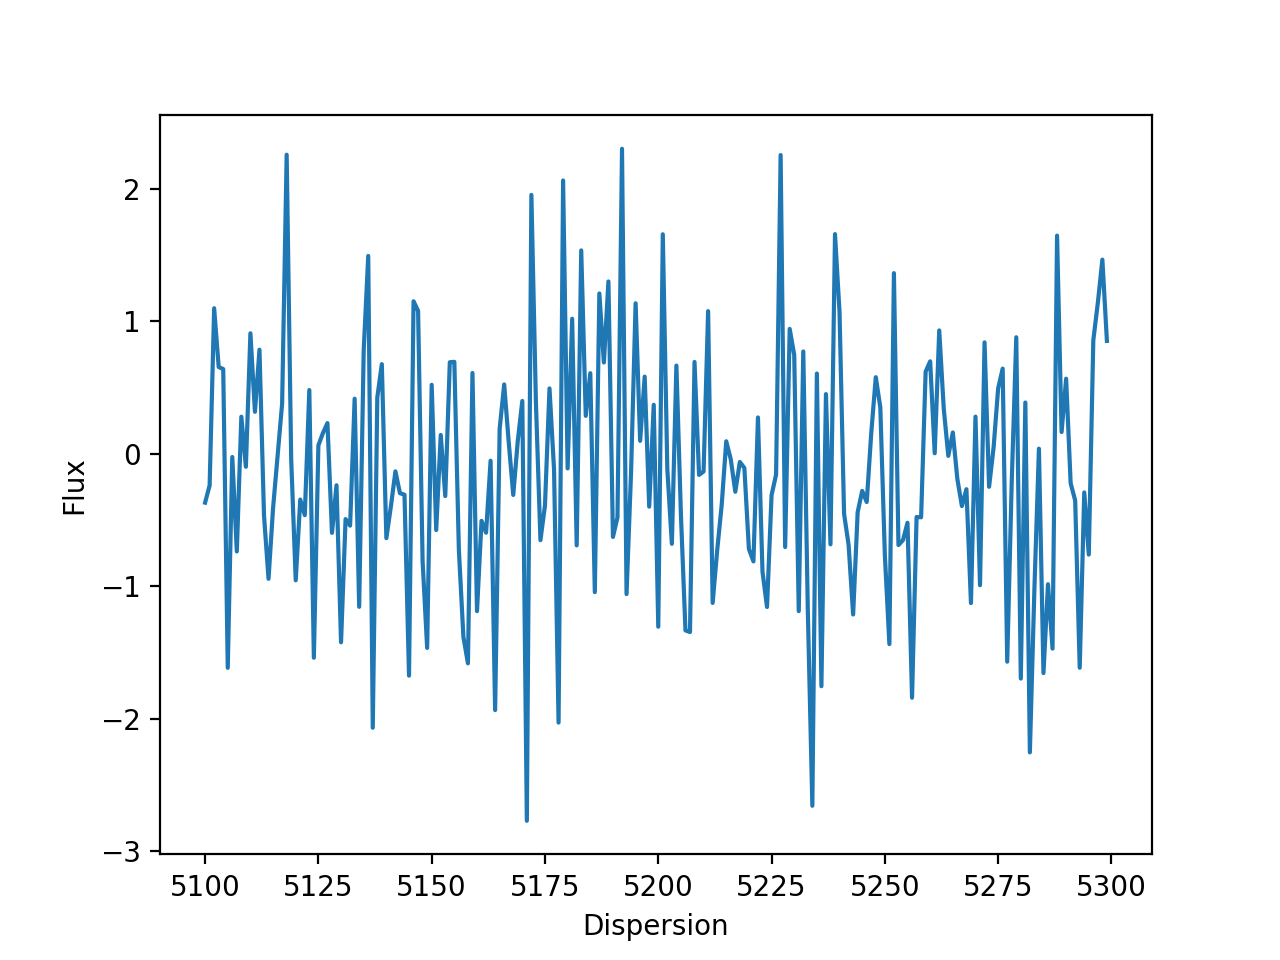
The simplest (and most powerful) way to create a Spectrum1D is to
create it explicitly from arrays or Quantity objects:
>>> import numpy as np
>>> import astropy.units as u
>>> import matplotlib.pyplot as plt
>>> from specutils import Spectrum1D
>>> flux = np.random.randn(200)*u.Jy
>>> wavelength = np.arange(5100, 5300)*u.AA
>>> spec1d = Spectrum1D(spectral_axis=wavelength, flux=flux)
>>> ax = plt.subplots()[1]
>>> ax.plot(spec1d.spectral_axis, spec1d.flux)
>>> ax.set_xlabel("Dispersion")
>>> ax.set_ylabel("Flux")
(Source code, png, hires.png, pdf)

Reading from a File
specutils takes advantage of the Astropy IO machinery and allows loading and
writing to files. The example below shows loading a FITS file. While specutils
has some basic data loaders, for more complicated or custom files, users are
encouraged to create their own loader.
>>> from specutils import Spectrum1D
>>> spec1d = Spectrum1D.read("/path/to/file.fits")
Including Uncertainties
The Spectrum1D class supports uncertainties, and
arithmetic operations performed with Spectrum1D
objects will propagate uncertainties.
Uncertainties are a special subclass of NDData, and their
propagation rules are implemented at the class level. Therefore, users must
specify the uncertainty type at creation time
>>> from specutils import Spectrum1D
>>> from astropy.nddata import StdDevUncertainty

>>> spec = Spectrum1D(spectral_axis=np.arange(5000, 5010)*u.AA, flux=np.random.sample(10)*u.Jy, uncertainty=StdDevUncertainty(np.random.sample(10) * 0.1))
Warning
Not defining an uncertainty class will result in an
UnknownUncertainty object which will not
propagate uncertainties in arithmetic operations.
Defining WCS
Specutils always maintains a WCS object whether it is passed explicitly by the
user, or is created dynamically by specutils itself. In the latter case, the
user need not be awrae that the WCS object is being used, and is can interact
with the Spectrum1D object as if it were only a simple
data container.
Currently, specutils understands two WCS formats: FITS WCS and GWCS. When a user does not explicitly supply a WCS object, specutils will fallback on an internal GWCS object it will create.
Note
To create a custom adapter for a different WCS class (i.e. aside from FITSWCS or GWCS), please see the documentation on WCS Adapter classes.
Providing a FITS-style WCS
>>> from specutils.spectra import Spectrum1D
>>> import astropy.wcs as fitswcs
>>> import astropy.units as u
>>> import numpy as np
>>> my_wcs = fitswcs.WCS(header={'CDELT1': 1, 'CRVAL1': 6562.8, 'CUNIT1': 'Angstrom', 'CTYPE1': 'WAVE', 'RESTFRQ': 1400000000, 'CRPIX1': 25})
>>> spec = Spectrum1D(flux=[5,6,7] * u.Jy, wcs=my_wcs)
>>> spec.wavelength
<Quantity [ 6538.8, 6539.8, 6540.8] Angstrom>
>>> spec.wcs.pixel_to_world(np.arange(3))
array([6.5388e-07, 6.5398e-07, 6.5408e-07])
Multi-dimensional Data Sets
Spectrum1D also supports the multidimensional case where you
have, say, an (n_spectra, n_pix)
shaped data set where each n_spectra element provides a different flux
data array and so flux and uncertainty may be multidimensional as
long as the last dimension matches the shape of spectral_axis This is meant
to allow fast operations on collections of spectra that share the same
spectral_axis. While it may seem to conflict with the “1D” in the class
name, this name scheme is meant to communicate the presence of a single
common spectral axis.
Note
The case where each flux data array is related to a different spectral
axis is encapsulated in the SpectrumCollection
object described in the related docs.
>>> from specutils import Spectrum1D

>>> spec = Spectrum1D(spectral_axis=np.arange(5000, 5010)*u.AA, flux=np.random.sample((5, 10))*u.Jy)
>>> spec_slice = spec[0]
>>> spec_slice.wavelength
<Quantity [0., 1., 2., 3., 4., 5., 6., 7., 8., 9.] Angstrom>
>>> spec_slice.flux
<Quantity [0.72722821, 0.32147784, 0.70256482, 0.04445197, 0.03390352,
       0.50835299, 0.87581725, 0.50270413, 0.08556376, 0.53713355] Jy>
While the above example only shows two dimensions, this concept generalizes to
any number of dimensions for Spectrum1D, as long as the spectral
axis is always the last.
Reference/API
Spectrum1D([flux, spectral_axis, wcs, …]) |
Spectrum container for 1D spectral data. |